Monday, July 18, 2011

Business Analysis, Automation, Offshoring and Jobs

One aspect of traditional business analysis was to look at how tasks within an organisation could be made more efficient.  Initially this meant looking at how database systems and software applications could be created to support people in organisations with the intention of lifting the productivity of these people. One effect of this (if done successfully) is that businesses need to employ less people to do the same amount of work. With the emergence of the internet it is now apparent that a large number of organisations have participated, or are participating in, a new wave of automation that significantly affects jobs.  This is particularly obvious in the retail sector, where the low overheads of having an online business allow prices that challenge many brick-and-mortar retailers (See for example: Harvey's war on Cheap TVs, Harvey Norman Reveals Online Move and Second Wave of Closures Hits Angus-Robertson). Of course, there is another element to this: offshoring.  While business analysis may involve looking at which processes can be offshored, Ford (2009) takes this further by linking the offshoring of jobs with the automation of jobs and suggests that in many cases this is an either-or choice.

Ford (2009) discusses how "knowledge economy jobs" are the ones that are most ripe for automation (counter-intuitively as they are supposed to be high skill jobs), however, a common precursor to automation of these jobs is that they are offshored to countries with lower wages. This again impacts local employment as these jobs are lost. See, for example, Online Shopping Threatens Local Jobs and also Foxconn Robots. Of course, one may argue that retail jobs are not really knowledge economy jobs. This is true and I will present Ford (2009)'s arguments that knowledge jobs are subject to the same offshoring/automation pressures in more detail shortly. Before that, lets just quickly consider the effects of either automation or offshoring.  One effect is that the price of goods and services goes down as costs are reduced. This is the claimed economic positive. However, another effect is that some people may be now unemployed or underemployed (at least temporarily). This effect is more dubious, as in theory the reduction in income is offset by cheaper goods and services and now - the big leap of faith - the loss of jobs in one area allows people to be re-deployed in other areas of the local economy.  Why wouldn't this happen? Rather than entering into an in-depth analysis of this, let me just suggest that it doesn't always work very well, with the American Rust Belt perhaps being one example (the last two paragraphs of this article are interesting in this regard). In such cases, mass relocations of people may be necessary leading to other, hidden, costs such as loss of amenity from prior infrastructure investments etc. Ford (2009) argues that there is also a psychological effect at play here.  As people see jobs dissappearing due to offshoring and/or automation, they reduce spending. This drop in demand for good and services may in itself be sufficient to lead to further job loses.

Now let us examine Ford (2009)'s case that knowledge workers' jobs are at risk from automation. The basic premise on which he builds his argument is that people underestimate what can be done with software and hardware.  Jobs, or aspects of jobs, that appear to require high levels of knowledge and skill can be automated sufficiently well to replace humans, even if the quality of outcomes is not quite as high in some cases (although it may well be higher).  The second aspect of his argument is that knowledge workers are often highly educated and highly paid.  Their high pay is what makes it worth trying to automate (or offshore) as the savings are considerably more than for a lower paid job. Even if only some aspects of a knowledge job are automated you can potentially reduce the workforce considerably. However, Ford imagines a far bleaker scene: wholesale automation of jobs across the board, well beyond the capacity for any 'new' jobs that might be created to absorb the losses.  He imagines a world where the rich get richer while the poor get poorer - until the economy stalls entirely at which point all wealth declines as demand for goods and services crashes (this is somewhat consistent with Wealth Trickling Up Not Down). Ford thinks this in fact was a contributing factor to the 2008 Global Financial Crisis (GFC).

There are a number of the reasons why Ford thinks that automation will be so successful.  While offshoring reduces costs eventually companies will look to automation . This will allow them to compete with cheap labour AND produce the high quality, precision products that people expect.  The other thing is that products themselves are being designed so as to support automation. Even a job such as motor mechanic which requires human skills such as visual recognition and physical manipulation he sees as threatened. Already cars can be repaired based on computerised diagnostic tools and it seems feasible that they may be designed in such a manner as to simplify automation for robotics. However, there are many more vulnerable jobs which require less human skill (see for example Food Inc). Supermarket shelf stocking is one with an appropriately designed physical layout. As another example we are all now familiar with the self-serve automated checkouts at our local supermarkets.  In fact, Ford picks up on this very type of activity: in the service sector automation pushes the difficult parts of the job onto the customer.   Another group he sees at immediate risk are those with what he calls "interface" jobs. These are people who essentially collect together documents and enter them into systems or send them to other systems.  As more businesses provide documents online (eg: bank statements) these types of exchange between systems will be easier to automate.

Ford is not the only one who has spotted this trend towards eliminating highly paid, highly educated specialised workers. Schmidt (2000) also points out that highly trained workers are expensive which drives employers to try and reduce the discretion of professionals by either standardising the work procedure or introducing "'expert' computer systems" (pg 38) the intention of which is to "transform the employee's decision making into a routine or rote activity and tend to strip the work-result of any imprint of the employee's own thinking" (pg 36).

Ford continues in his book to identify a number of social dangers that may arise from increasing automation and wealth inequality. This raises some very interesting questions, most of which I will leave for discussion at another time. However, one of interest is the predicament of China. China has developed as the "world's factory" due to its low-cost low-paid labour force.  These people expect at some stage to reap the benefits of their industrialisation by achieving higher standards of living.  However, Ford fears that any attempt to improve the conditions or pay of Chinese workers will lead to automation of China's factories and mass-unemployment in China (see the Foxconn article again). He also accuses automation and off-shoring of contributing to the GFC, but more on this later.


References

Ford, M. 2009. The Lights in the Tunnel, Acculant.

Schmidt, J. 2000. Disciplined Minds: A Critical Look at Salaried Professionals and the Soul-Battering System that Shapes their Lives, Rowman and Littlefield.

Labels: ,

Monday, July 11, 2011

Business Process Modelling Basics

This material is sourced (except where noted) from the BPMN Introductory Whitepaper available here.

Business Process Modelling Language

Business Process Modelling Language (BPML) like UML and many other graphical modelling languages aims to represent processes. However, it is intended in particular to be a non-technical language for non-technical business users. As such it allows quite detailed descriptions of processes, but not down to the technical level of UML. In this lesson we will consider some simple representations of processes as an introduction to BPML. You will only be required to produce diagrams to the level described here, although more sophisticated representations are possible. As with UML, the analyst determines how much detail should be included and what is represented. Also like UML, BPML is primarily a communication and documentation tool. It is intended to be used to help both users and analysts understand how processes currently do, or will work. Also like UML it relies on a graphical representation, in this case called a Business Process Diagram (BPD) which is produced using Business Process Modelling Notation (BPMN).

Business Process Diagrams

BPDs are designed to be simple while allowing for the complexity of business processes. They have four categories of graphical elements:

  • Flow Objects
  • Connecting Objects
  • Swimlanes
  • Artifacts

Flow Objects

There are three core elements in the flow objects category:
  • Event – represented by a circle. Show something that “happens”. Three different types depending on when they affect flow.
  • Activity – represented by a round cornered rectangle. Represents work performed, can be atomic or compound.
  • Gateway – represented by a diamond shape. Used to represent decisions or alternatives.
These three objects are shown in their diagrammatic form below:


Activities and gateways are similar to their graphical equivalents represented in flowcharts. Activities can be though of as some action taking place, while gateways indicate some choice or alternative paths for process to progress along. However, events have no obvious analogy so we will look at these in more detail.

Events

Recall that these are represented by circles. Events affect the flow of a process usually have a cause or an impact (also called triggers and results). There are three types of events differing by when they affect the flow:
  1. Start
  2. Intermediate
  3. End
A Start event is one that indicates something has happened in the environment that triggers a process to start. For example, a customer telephone call or email being received. It is shown by a circle with a thin border. An End event shows the logical completion of a process, it is depicted by circle with a single thick border. The Intermediate event shows the temporary suspension of a process and may be used to continue the process on a separate diagram.

Connecting Objects

Connecting objects are arrows that indicate various relationships between other graphical elements on the diagram. There are three objects in this category:
  1. Sequence flow – represented by a solid line and arrow head. Shows sequence (order). Most usually connects the events and activities that make up the process showing the path of activity followed under various circumstances.
  2. Message flow – represented by dashed line and open arrow head. Shows the flow of messages or information. These arrows typically show communication between processes, for example information flowing from a customer's ordering process to a businesses sales process and vice-versa.
  3. Association – represented by a dotted line with a line arrowhead. Associated things with flow objects (such as inputs and outputs). May indicate various data flowing in and out of the process but not directly into other processes (i.e may be stored before later use by another process or the same process later).


Pools and Swimlanes

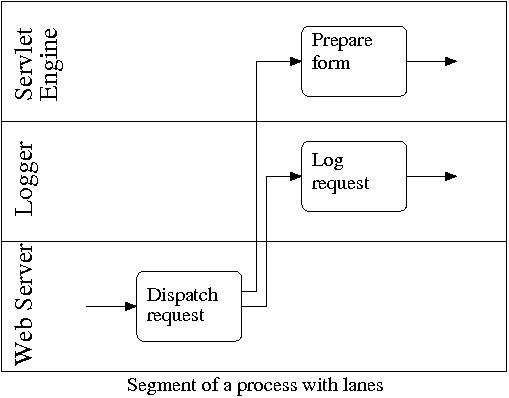
Businesses are often divided logically into functional departments (eg. accounting, marketing, sales, warehouse etc). Swimlanes show each of these departments relevant to a process. Using swimlanes it can be seen when a process is crossing from the responsibility of one department to another. If two or more organisations are involved in a transaction (and typically for our purposes two are) then each organisation ay have its own internal swimlanes (i.e departments). In this case, each organisations is considered as a pool consisting of its own swimlanes. Therefore the two graphical objects related to different organisations and their departments are:
  • Pool – represents a participant in a process. Usually in the context of B2B situations.
  • Lane – represents a sub-partition within a pool. Lanes are used to organise and categorise activities.
The diagram below shows a pool (could represent one party/organisation in the process) and a pool divided into swimlanes (shows two departments in one party/organisation associated with the process. Note, only those departments relevant to the process are depicted in a BPD).


Activities in pools are self contained processes. Sequences cannot cross between pools, but messages may be used to show communication between pools. For example, in the following diagram a process cannot cross from one organisation to another, but messages can, and always in sequence. Like a telephone conversation, each request receives an answer before the next request is placed.


In the following example, we can see one party/organisation divided into swimlanes. Typically this will be the organisation you are analysing. Unless you are also analysing the other organisation you typically will not show their internal departments (i.e their pool will not have swimlanes) as you cannot control their internal operations and divisions. You do, however, need to understand how they will interact with your process (i.e the messages you will exchange with them and for this purpose it is necessary to show some details of their internal processes (in a single lane). The diagram below shows that within swimlanes it may be possible for a process to branch (fork) of multiple parallel processes internally.


Artifacts

Context can be added through the creation of artifacts. Three types are defined (but others can be added by the modeller ):
  • Data Object – represented by a page icon. These show how data is required or produced by activities. They are connected through associations.
  • Group – represented by a rounded corner rectangle with a dashed outline. Groups items for documentation or analysis purposes but not for sequencing.
  • Annotation – represented by half box and a dotted line. These are a mechanism to provide text information. 


    Uses of BPMN

    BPMN is designed to cover process segments as well as end-to-end business processes at different levels of granularity. Within these objectives, two basic models are possible with BPD:
    1. Collaborative (B2B) Processes
    2. Internal Business Processes

    Collaborative B2B Processes

    These diagrams show the interactions between 2 or more business entities and show a global point of view (i.e. do not favour any particular participant. Compare with a context diagram). The interactions consist of sequence of activities and message exchange patterns.
    The activities for collaboration participants are considered as “touch-points”. These are activities that are visible to the public for each participant. They are called public or abstract (if looking at just one participant).
    The diagram below shows an example of a collaboration. Each of the processes will have more detail internally, but we are only interested in the abstraction seen by the public:


    Internal Business Processes

    Internal business processes are based on the view point of a single organisation, although they will still show interactions with external participants. Activities that are not visible to the public are depicted. The sequence for a single process cannot cross out of a pool. We may start with a high level process and then show more detail in additional diagrams (drill-down). For our Bookshop example the sub-process Send Catalog may be represented in more detail as:


    Note, that purists will argue that a lane should not have two or more consecutive activities without crossing lanes such as seen with the last three activities in the Sales lane.

    Why Use BPMN?

    BPMN provides a single standard notation intended to replace a range of varying standards used across industry. The process models developed by business people need to be manually translated to technical execution models for IT people and BPMN provides a mapping to technical specifications but avoiding the overt complexity and technical focus of UML.

    Labels: , ,