Business Process Modelling Basics
This material is sourced (except where noted) from the BPMN Introductory Whitepaper available here.
Business Process Modelling Language
Business Process Modelling Language (BPML) like UML and many other graphical modelling languages aims to represent processes. However, it is intended in particular to be a non-technical language for non-technical business users. As such it allows quite detailed descriptions of processes, but not down to the technical level of UML. In this lesson we will consider some simple representations of processes as an introduction to BPML. You will only be required to produce diagrams to the level described here, although more sophisticated representations are possible. As with UML, the analyst determines how much detail should be included and what is represented. Also like UML, BPML is primarily a communication and documentation tool. It is intended to be used to help both users and analysts understand how processes currently do, or will work. Also like UML it relies on a graphical representation, in this case called a Business Process Diagram (BPD) which is produced using Business Process Modelling Notation (BPMN).Business Process Diagrams
BPDs are designed to be simple while allowing for the complexity of business processes. They have four categories of graphical elements:- Flow Objects
- Connecting Objects
- Swimlanes
- Artifacts
Flow Objects
There are three core elements in the flow objects category:- Event – represented by a circle. Show something that “happens”. Three different types depending on when they affect flow.
- Activity – represented by a round cornered rectangle. Represents work performed, can be atomic or compound.
- Gateway – represented by a diamond shape. Used to represent decisions or alternatives.

Activities and gateways are similar to their graphical equivalents represented in flowcharts. Activities can be though of as some action taking place, while gateways indicate some choice or alternative paths for process to progress along. However, events have no obvious analogy so we will look at these in more detail.
Events
Recall that these are represented by circles. Events affect the flow of a process usually have a cause or an impact (also called triggers and results). There are three types of events differing by when they affect the flow:- Start
- Intermediate
- End
Connecting Objects
Connecting objects are arrows that indicate various relationships between other graphical elements on the diagram. There are three objects in this category:- Sequence flow – represented by a solid line and arrow head. Shows sequence (order). Most usually connects the events and activities that make up the process showing the path of activity followed under various circumstances.
- Message flow – represented by dashed line and open arrow head. Shows the flow of messages or information. These arrows typically show communication between processes, for example information flowing from a customer's ordering process to a businesses sales process and vice-versa.
- Association – represented by a dotted line with a line arrowhead. Associated things with flow objects (such as inputs and outputs). May indicate various data flowing in and out of the process but not directly into other processes (i.e may be stored before later use by another process or the same process later).

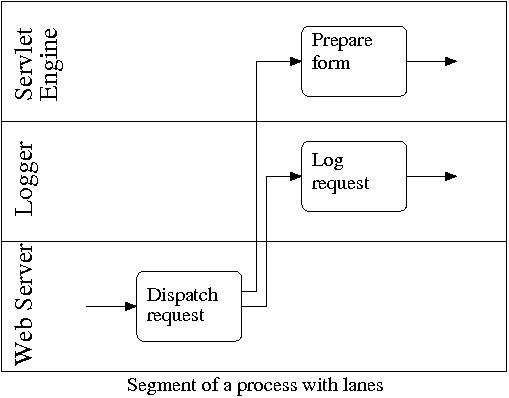
Pools and Swimlanes
Businesses are often divided logically into functional departments (eg. accounting, marketing, sales, warehouse etc). Swimlanes show each of these departments relevant to a process. Using swimlanes it can be seen when a process is crossing from the responsibility of one department to another. If two or more organisations are involved in a transaction (and typically for our purposes two are) then each organisation ay have its own internal swimlanes (i.e departments). In this case, each organisations is considered as a pool consisting of its own swimlanes. Therefore the two graphical objects related to different organisations and their departments are:- Pool – represents a participant in a process. Usually in the context of B2B situations.
- Lane – represents a sub-partition within a pool. Lanes are used to organise and categorise activities.

Activities in pools are self contained processes. Sequences cannot cross between pools, but messages may be used to show communication between pools. For example, in the following diagram a process cannot cross from one organisation to another, but messages can, and always in sequence. Like a telephone conversation, each request receives an answer before the next request is placed.

In the following example, we can see one party/organisation divided into swimlanes. Typically this will be the organisation you are analysing. Unless you are also analysing the other organisation you typically will not show their internal departments (i.e their pool will not have swimlanes) as you cannot control their internal operations and divisions. You do, however, need to understand how they will interact with your process (i.e the messages you will exchange with them and for this purpose it is necessary to show some details of their internal processes (in a single lane). The diagram below shows that within swimlanes it may be possible for a process to branch (fork) of multiple parallel processes internally.
Artifacts
Context can be added through the creation of artifacts. Three types are defined (but others can be added by the modeller ):- Data Object – represented by a page icon. These show how data is required or produced by activities. They are connected through associations.
- Group – represented by a rounded corner rectangle with a dashed outline. Groups items for documentation or analysis purposes but not for sequencing.
- Annotation – represented by half box and a dotted line. These are a mechanism to provide text information.

Uses of BPMN
BPMN is designed to cover process segments as well as end-to-end business processes at different levels of granularity. Within these objectives, two basic models are possible with BPD:- Collaborative (B2B) Processes
- Internal Business Processes
Collaborative B2B Processes
These diagrams show the interactions between 2 or more business entities and show a global point of view (i.e. do not favour any particular participant. Compare with a context diagram). The interactions consist of sequence of activities and message exchange patterns.The activities for collaboration participants are considered as “touch-points”. These are activities that are visible to the public for each participant. They are called public or abstract (if looking at just one participant).
The diagram below shows an example of a collaboration. Each of the processes will have more detail internally, but we are only interested in the abstraction seen by the public:

Internal Business Processes
Internal business processes are based on the view point of a single organisation, although they will still show interactions with external participants. Activities that are not visible to the public are depicted. The sequence for a single process cannot cross out of a pool. We may start with a high level process and then show more detail in additional diagrams (drill-down). For our Bookshop example the sub-process Send Catalog may be represented in more detail as:
Note, that purists will argue that a lane should not have two or more consecutive activities without crossing lanes such as seen with the last three activities in the Sales lane.
Why Use BPMN?
BPMN provides a single standard notation intended to replace a range of varying standards used across industry. The process models developed by business people need to be manually translated to technical execution models for IT people and BPMN provides a mapping to technical specifications but avoiding the overt complexity and technical focus of UML.Labels: BPM, Business Analysis, Business process modelling
posted by Matthew Mitchell @ 11:11 PM
0 Comments
![]()


0 Comments:
Post a Comment
Subscribe to Post Comments [Atom]
<< Home